

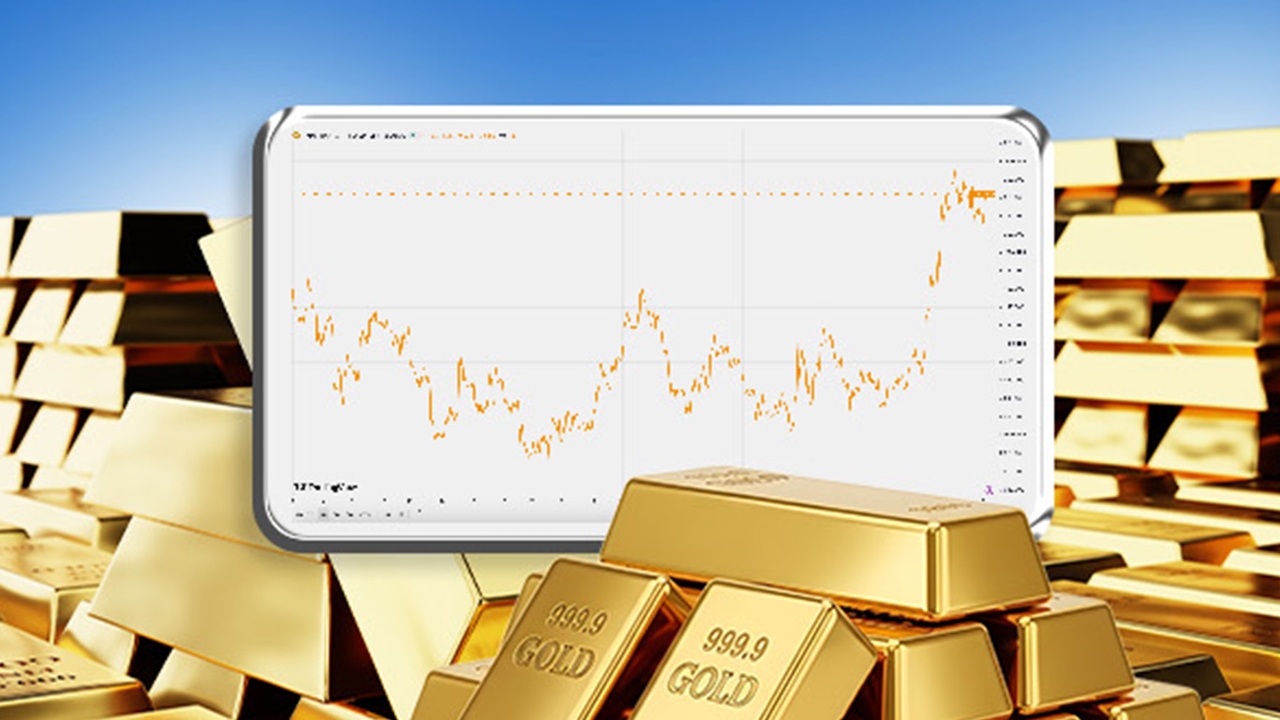
Global gold prices have revived, recently trading around $4,265.47 per ounce, up more than 3.17% in the past month. This follows a continuous decline from a record high in January 2026. This rebound coincides with signs of capital flowing back into the safe-haven asset, gold.
Let's explore whether this marks the start of a new uptrend or merely a short-term bounce amid ongoing market uncertainty.
Reviewing the overall picture in 2026, gold reached an all-time high near $5,598 per ounce in late January before correcting sharply over 28% to around $4,020 by late July.
The main cause was the hawkish stance of Federal Reserve Chair Kevin Warsh, who insisted on maintaining tight monetary policy despite slowing inflation, leaving open the possibility of further rate hikes. This stance led to continuous redemptions from U.S. gold ETFs during that period.
Earlier, Goldman Sachs lowered its year-end gold price target for 2026 from $5,400 to $4,900, citing weakening ETF demand and the Fed possibly delaying rate cuts.
However, recent support driving gold prices higher comes from weaker-than-expected U.S. economic data, causing a weaker dollar, alongside progress in U.S.-Iran negotiations to ease prolonged tensions. This helped reduce inflationary pressures from falling oil prices, lowering the chance of further Fed rate hikes.
These factors have pushed gold prices up, but more notably, ETF capital inflows have returned, possibly signaling recovering investor confidence.
Sirilak Pakotiprapa, Director of Analysis at Hua Seng Heng Gold Futures Co., Ltd. She told Thairath Money that gold prices are showing signs of improvement. Last month, prices fluctuated narrowly between $3,960 and $4,200 before breaking above resistance, marking a “buy signal.”
A key factor supporting this positive signal is the easing of heavy selling pressure and the gradual return of buying after substantial ETF redemptions, including 84 tons sold in March and 74 tons in June.
Recent data show net inflows of 23.5 tons into gold ETFs last month, indicating a clear reduction in selling. Major buyers returning include investors from the European Union and China, with buying reported for 14 consecutive days, reflecting significant demand.
Assessing whether the gold price trend has fully turned bullish, Sirilak said a short-term uptrend is likely, raising the price range. Support is now around $4,100–$4,200, with resistance moving up to $4,400–$4,500.
However, the long-term trend is not yet confirmed. Technically, prices need to break and hold above approximately $4,500 to confirm a sustained uptrend.
Investors should watch three key factors that could drive a true long-term bullish reversal:
1. Conflict and war developments, especially geopolitical tensions involving Iran and the Strait of Hormuz. A formal end to hostilities would likely trigger strong gold buying.
2. Clarity on U.S. interest rate direction, particularly the Fed’s September Dot Plot forecast, which will indicate whether the rate hike cycle has truly ended.
3. Long-term gold purchases by central banks worldwide. In Q2, central banks bought 289 tons, showing they tend to accumulate more during price corrections.
For investment strategies, short-term traders focusing on speculation are advised to buy on dips near $4,200 and target profits between $4,400 and $4,500.
Long-term investors have a good opportunity to start accumulating gold gradually, with initial support near $4,100. If prices decline close to $4,000 in a worst-case scenario, that would be an attractive level for full accumulation.
Analysis section MTS Gold Co., Ltd. (Mae Thong Suk) They state that technically, the short-term overall gold price trend has returned to an uptrend after prices surged above short- and medium-term moving averages.
As long as intraday prices hold above $4,240, there remains potential for a recovery test of key resistance near $4,300.
If prices break and hold above this level, it would confirm positive momentum, increasing the chance of further price gains.
However, if prices fail to surpass this resistance, profit-taking selling pressure may push prices back into a sideways range between $4,200 and $4,300.
Short-term support is assessed at $4,200 and $4,150, with resistance at $4,300 and $4,350.
For stock and investment news, visit Thairath Money at
Follow the Facebook page Thairath Money at this link