

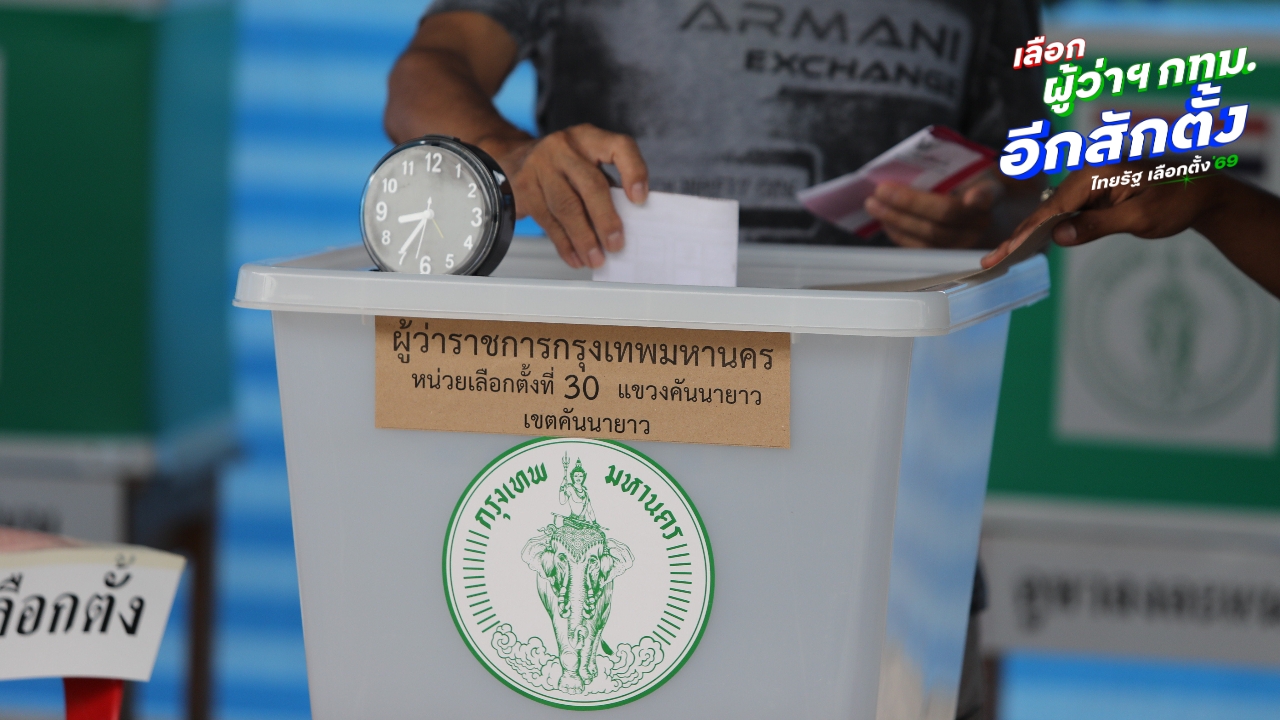
The 2026 Bangkok governor and councilor elections: NIDA Poll reveals that most Bangkok residents plan to vote for independent candidates without political party support.
On 31 May 2026, the NIDA Poll Center at the National Institute of Development Administration (NIDA) announced the results of a survey on "Independent or Party-Affiliated Candidates for Bangkok Governor." The survey was conducted between 25-26 May 2026 among residents aged 18 and over with voting rights in Bangkok, covering all 50 districts and a range of education levels, occupations, and incomes, totaling 1,310 respondents. It examined the voting tendencies of Bangkok residents for the Bangkok governor and Bangkok council members (BMC) elections scheduled for 28 June 2026.
When asked about the voting tendencies of Bangkok residents for the governor election, for the election on 28 June 2026, it was found that
Regarding the voting tendencies of Bangkok residents for Bangkok council member (BMC) candidates, for the election on 28 June 2026, it was found that
Finally, when asked about the tendency of Bangkok voters to choose the governor and councilor candidates from the same political party or political group, the results showed that
